


MARCH 2020 SALES STATS OSHAWA
Tuesday, April 14, 2020

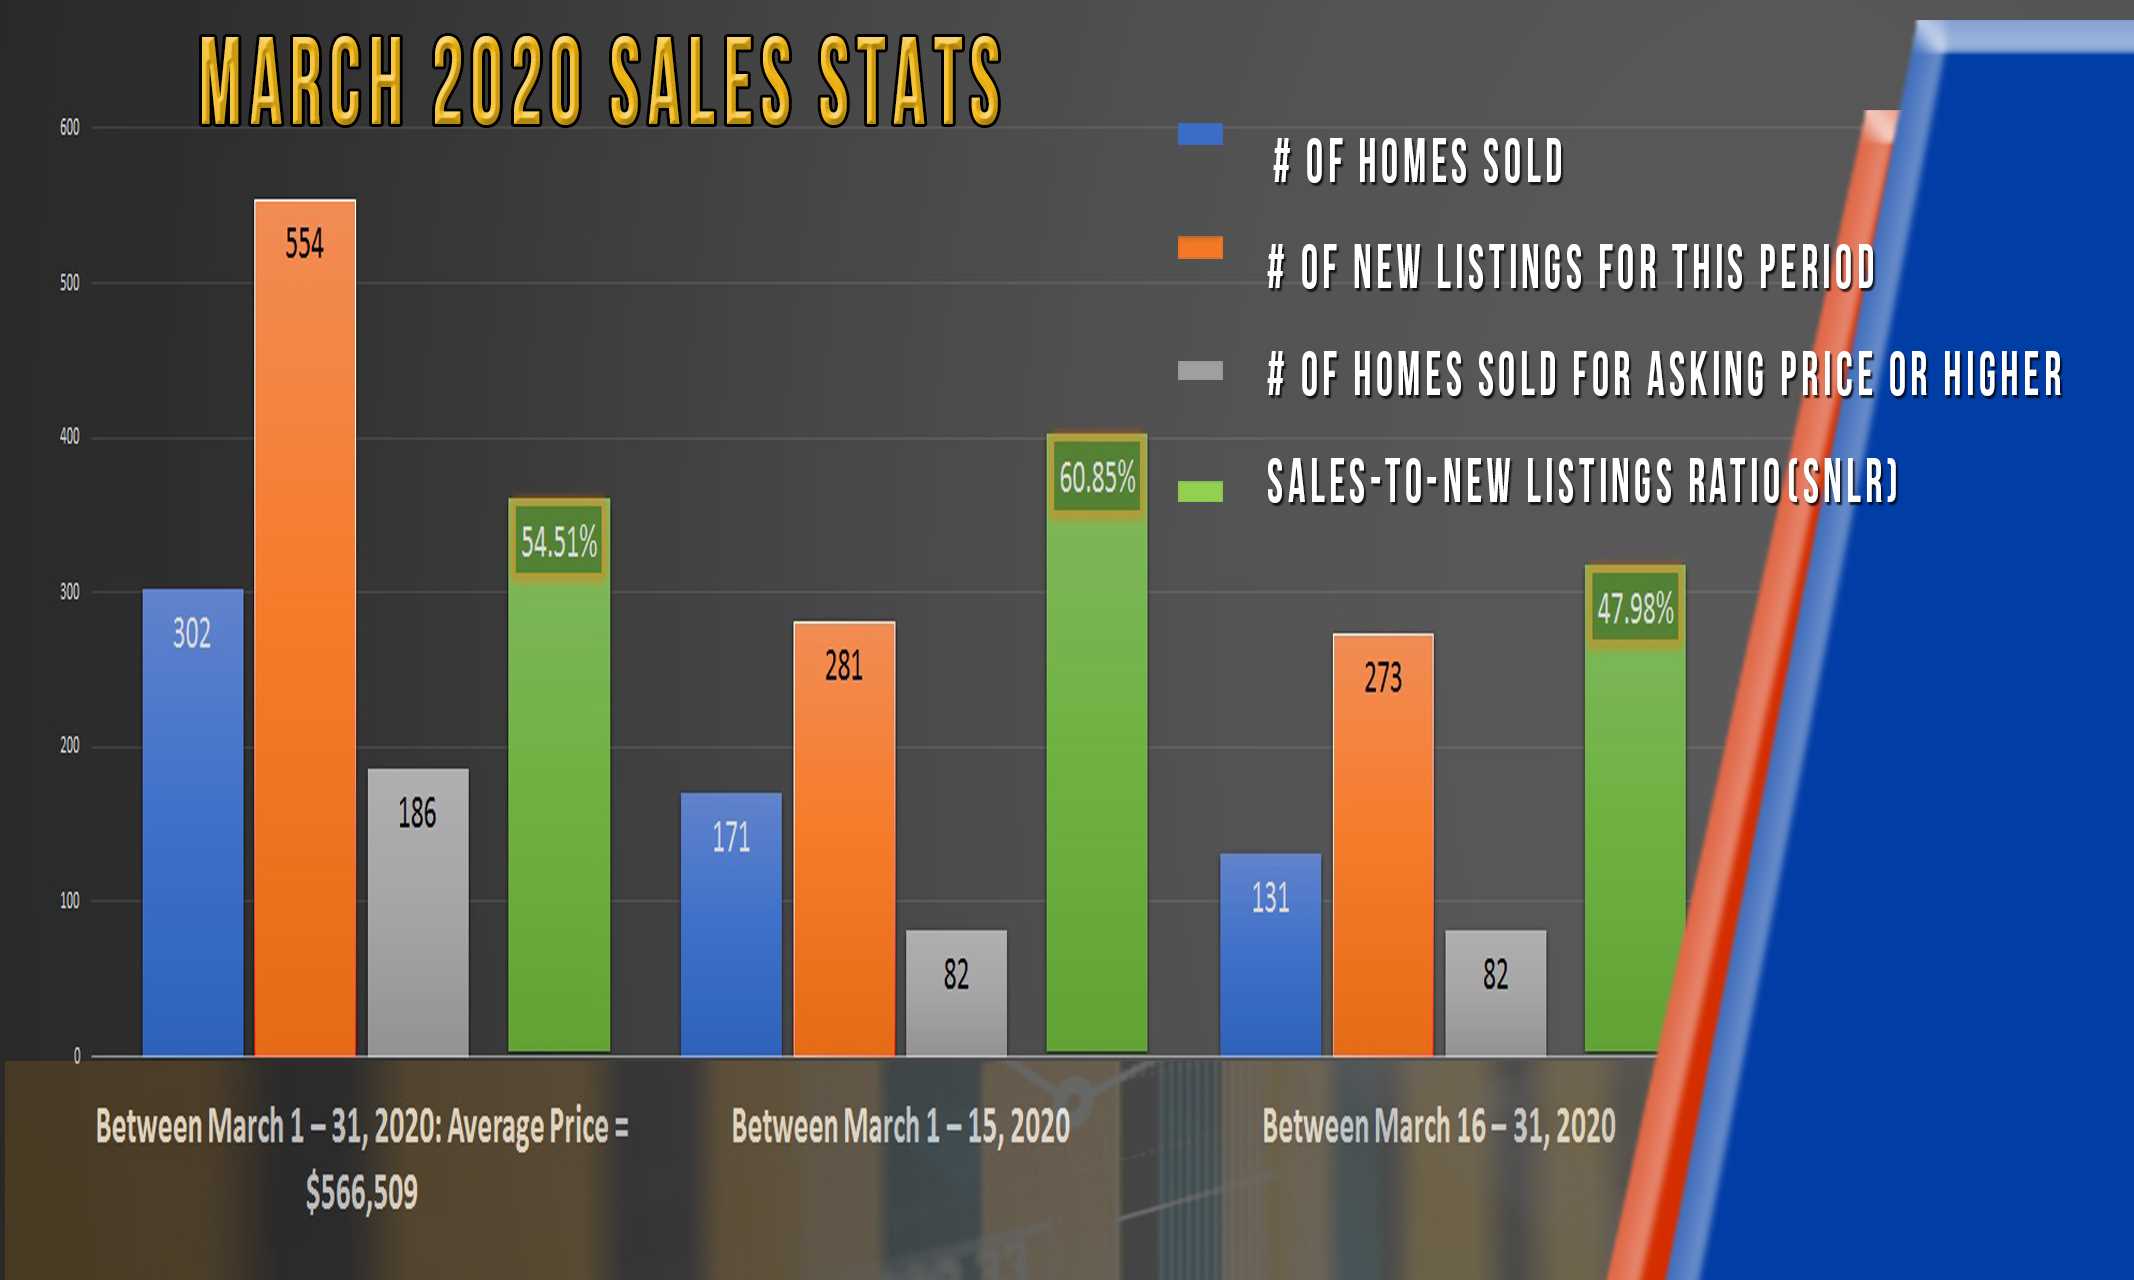
Between March 1 – 31, 2020: Average Price = $566,509
1) # of Homes Sold 302
2) # of New Listings for this period 554
3) # of Homes Sold for Asking Price or Higher 186
4) Sales-to-New Listings Ratio (SNLR) 54.51%
Between March 1 – 15, 2020
1) # of Homes Sold 171
2) # of New Listings for this period 281
3) # of Homes Sold for Asking Price or Higher 82
4) Sales-to-New Listings Ratio (SNLR) 60.85%
Between March 16 – 31, 2020
1) # of Homes Sold 131
2) # of New Listings for this period 273
3) # of Homes Sold for Asking Price or Higher 82
4) Sales-to-New Listings Ratio (SNLR) 47.98%
Traditionally, March is the start of our spring market. The sales for the first two weeks were outstanding. With 171 sales up to March 15th, even if Oshawa just posted the same number of sales from March 16th – 31st , (highly unlikely since the market really heats up after the March Break), we would have ended up with 342 total sales for the month. That would have resulted in 110 more homes sold over the 232 sales of March 2019! To illustrate further how hot the market was before COVID-19 basically put the brakes on it, the wildest, craziest market in history was the beginning of 2017. In March 2017, we sold 396 homes, so there were just 64 less sales last month!
Tomorrow, Clarington’s March 2020 sales stats, with Courtice and Bowmanville highlighted.
