


MARCH 2020 SALES STATS PICKERING
Tuesday, April 14, 2020

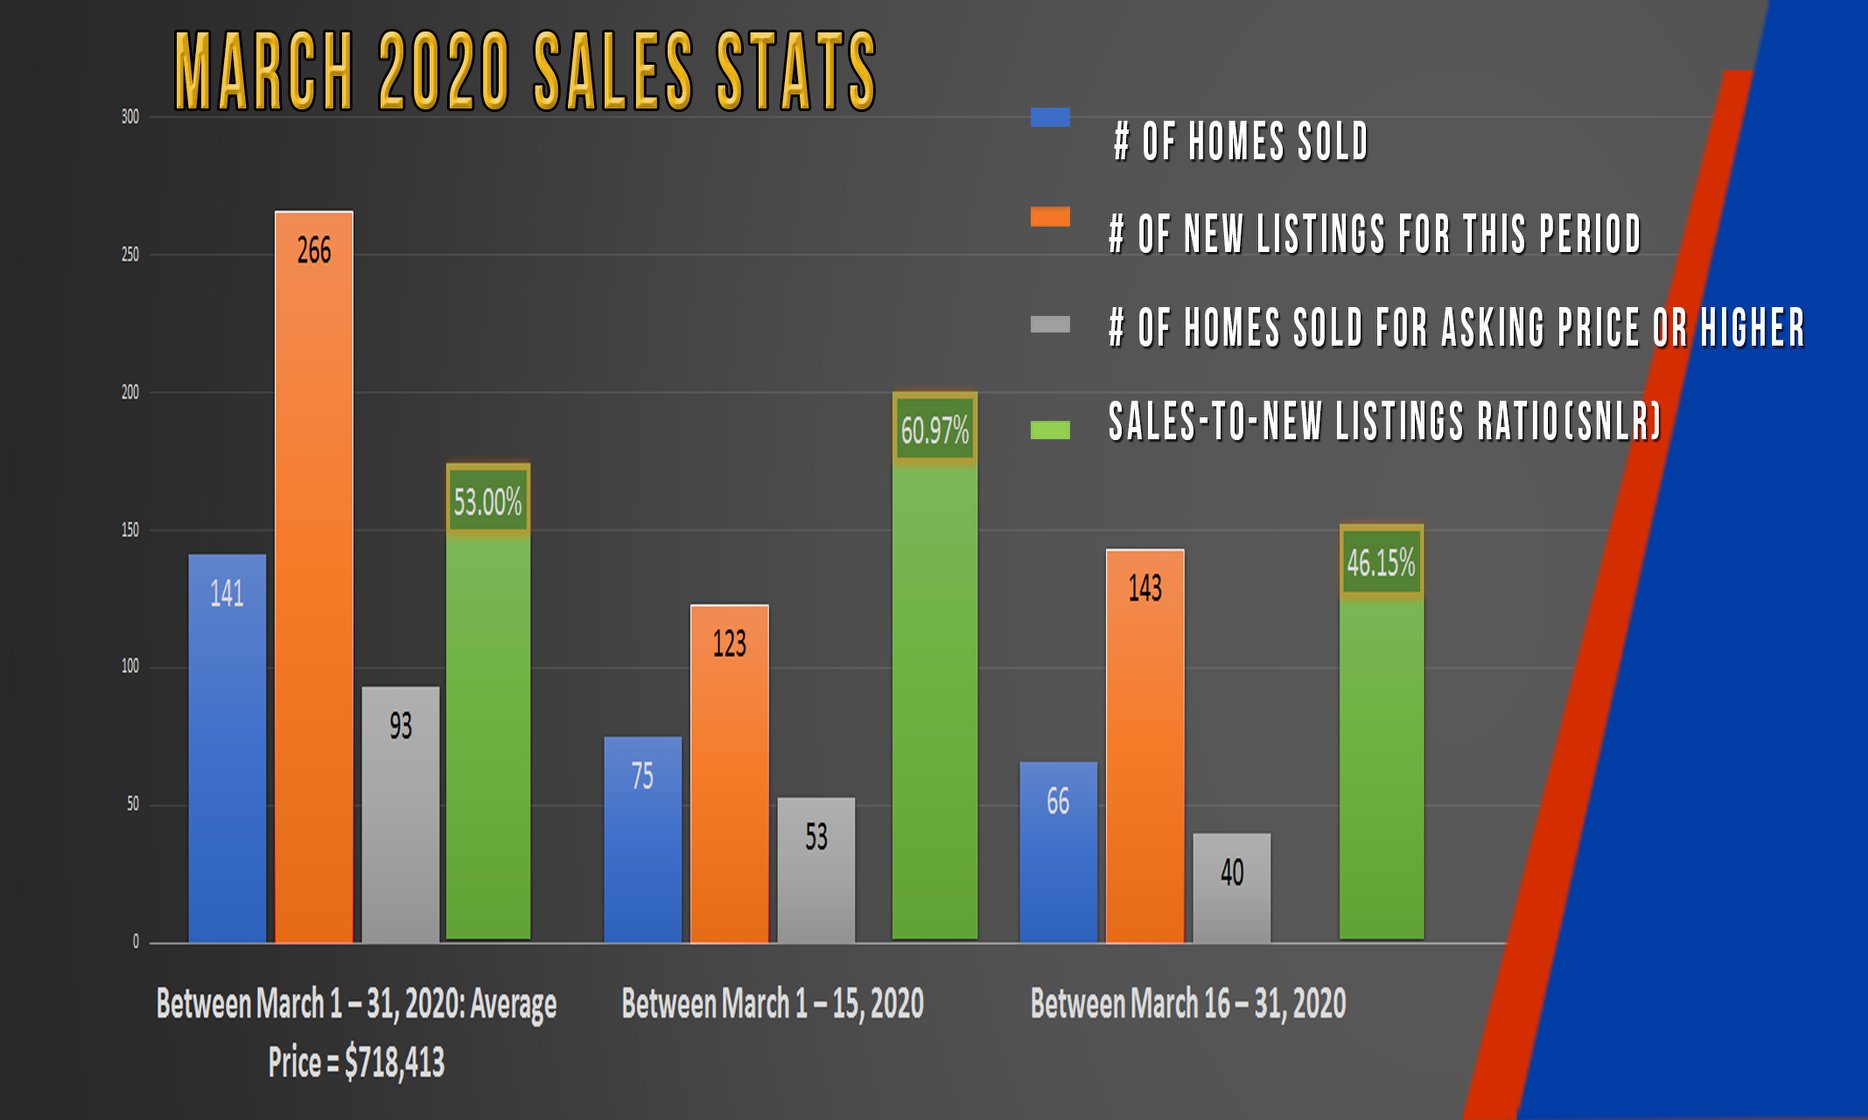
Between March 1 – 31, 2020: Average Price = $718,413
1) # of Homes Sold 141
2) # of New Listings for this period 266
3) # of Homes Sold for Asking Price or Higher 93
4) Sales-to-New Listings Ratio (SNLR) 53.00%
Between March 1 – 15, 2020
1) # of Homes Sold 75
2) # of New Listings for this period 123
3) # of Homes Sold for Asking Price or Higher 53
4) Sales-to-New Listings Ratio (SNLR) 60.97%
Between March 16 – 31, 2020
1) # of Homes Sold 66
2) # of New Listings for this period 143
3) # of Homes Sold for Asking Price or Higher 40
4) Sales-to-New Listings Ratio (SNLR) 46.15%
As we saw in the sales stats for all Durham Region, the market in Pickering was much stronger in the first half of March over the second half of the month. Traditionally, we see both buyers and sellers come out in full force after the March Break, so it’s no surprise that the number of new listings jumped by 20 between March 16 th – 31 st (+16.26%). However, the number of homes sold dropped by 9 homes (-12%).
I also mentioned this for the Durham Region stats – usually we sell more homes as the month goes on, so something drastic must have happened to cause the number of sales to drop. The obvious reason was COVID-19.
