


MARCH 2020 SALES STATS CLARINGTON
Thursday, April 16, 2020

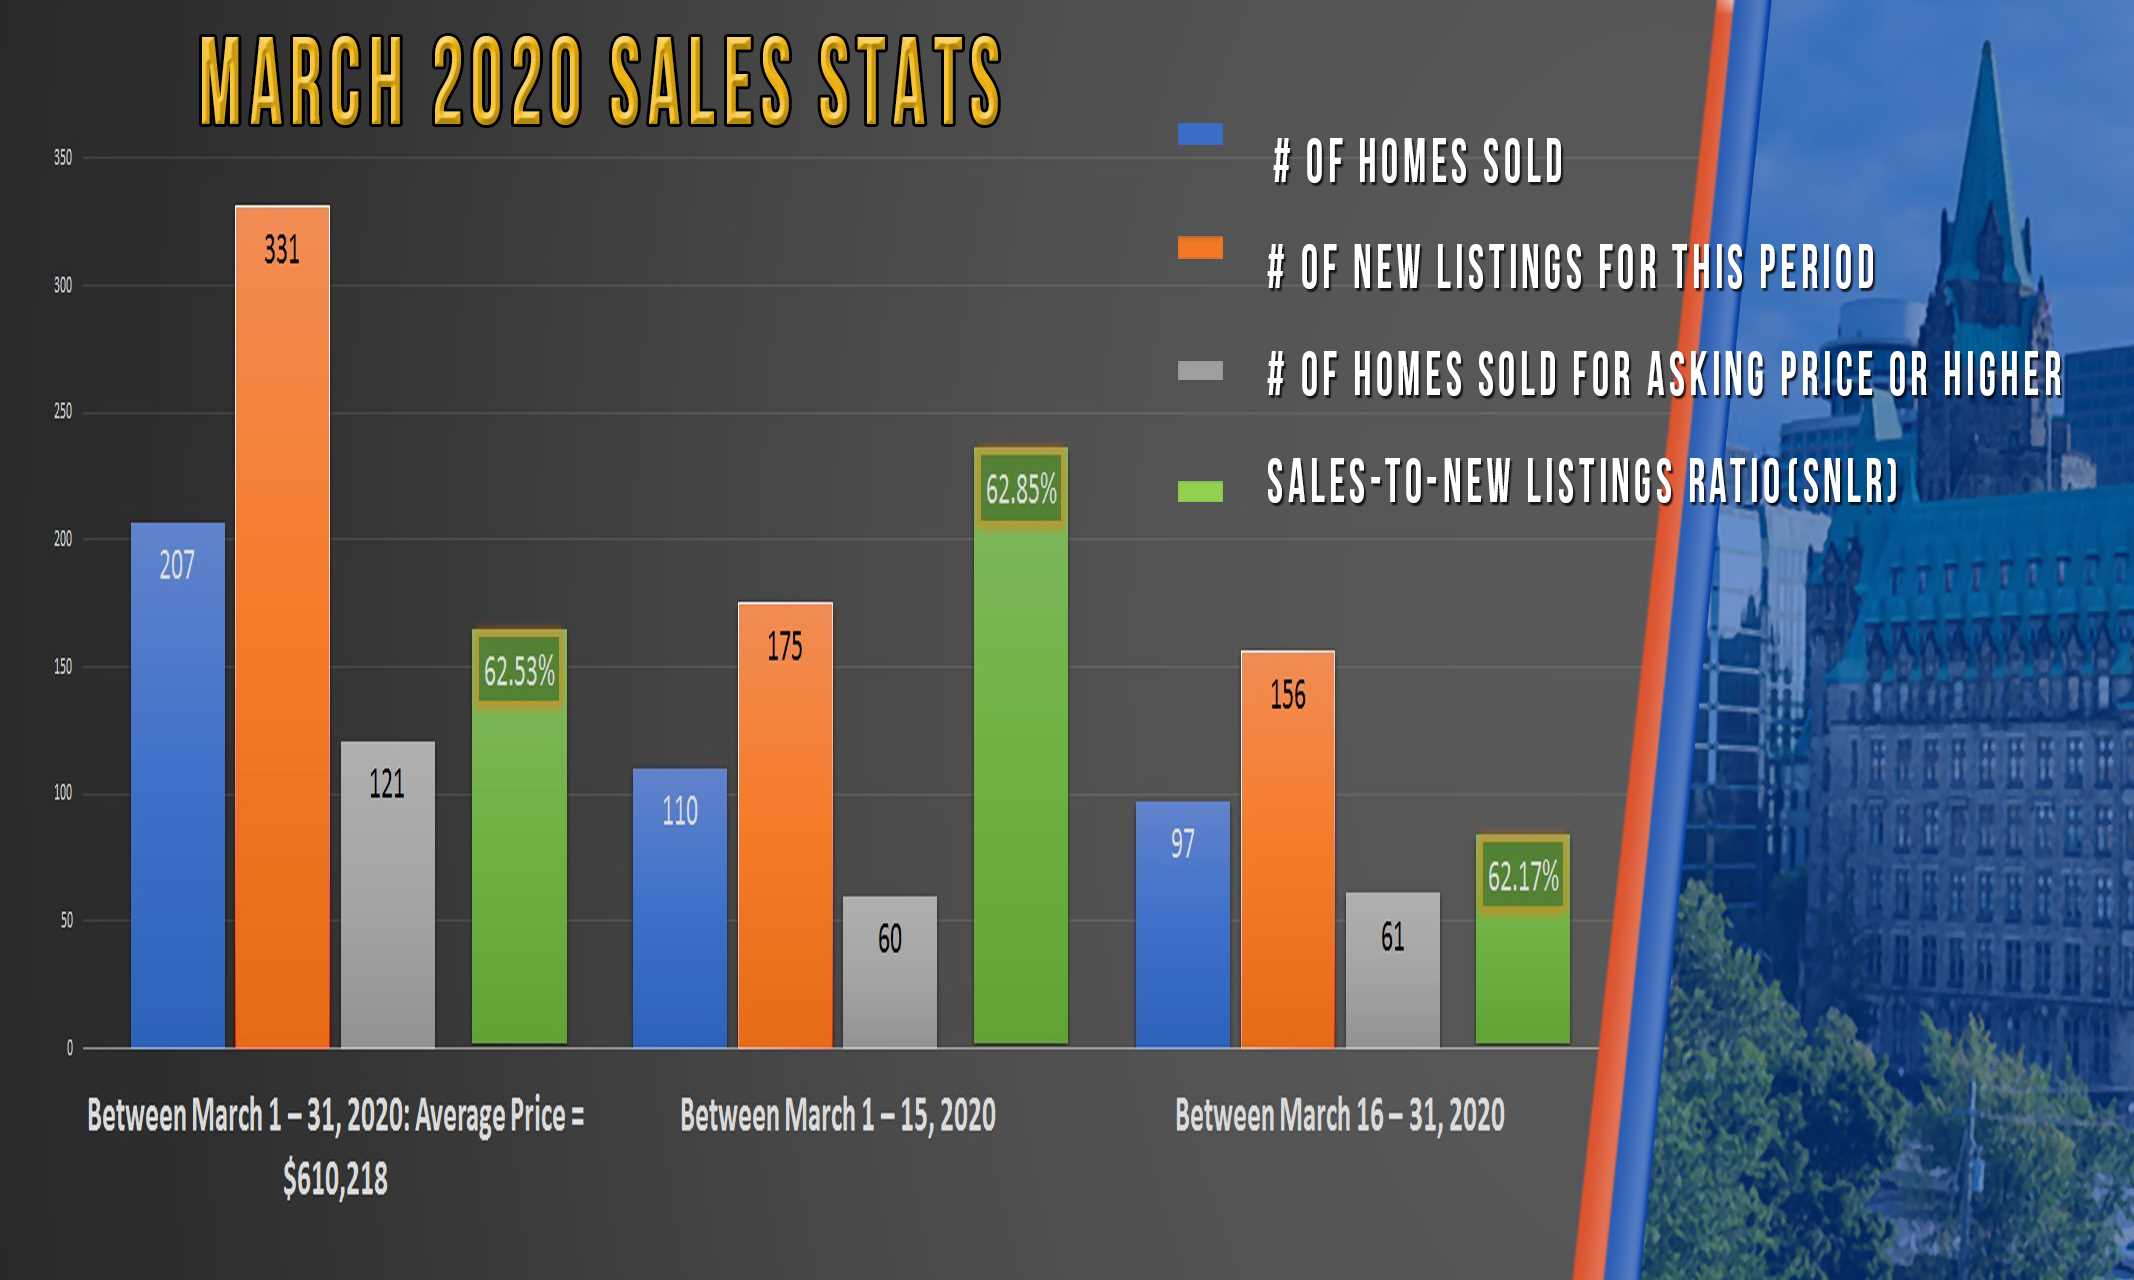
Between March 1 – 31, 2020: Average Price = $610,218
1) # of Homes Sold 207
2) # of New Listings for this period 331
3) # of Homes Sold for Asking Price or Higher 121
4) Sales-to-New Listings Ratio (SNLR) 62.53%
Between March 1 – 15, 2020
1) # of Homes Sold 110
2) # of New Listings for this period 175
3) # of Homes Sold for Asking Price or Higher 60
4) Sales-to-New Listings Ratio (SNLR) 62.85%
Between March 16 – 31, 2020
1) # of Homes Sold 97
2) # of New Listings for this period 156
3) # of Homes Sold for Asking Price or Higher 61
4) Sales-to-New Listings Ratio (SNLR) 62.17%
Clarington covers a lot of area, with 5 municipalities within it: Courtice, Bowmanville, Rural Clarington, Newcastle and Orono. Although it has the most space by far, Rural Clarington has fewer homes than Courtice and Bowmanville.
I’ve said this to a lot of potential buyers that Courtice, and especially Bowmanville, are probably among the fastest growing and in-demand areas in the GTA. With that said, I thought I would also show you Courtice and Bowmanville’s March stats.
We would like to hear from you! If you have any questions, please do not hesitate to contact us. We are always looking forward to hearing from you! We will do our best to reply to you within 24 hours !
